

This post is long overdue! Over the summer, from the comfort of my childhood bedroom, I worked with an awesome group of fellow undergrads, a couple of graduate students and my research advisors to run object detection on a TON of network camera data.
Our research group has access to a huge database of worldwide network camera data: publicly accessible camera footage coming from security camera streams, cameras outside restaurants and beaches to observe weather or pedestrian activity, and many, many traffic cameras. When the pandemic hit, my advisor thought it would be a no-brainer to try to detect people in the footage and infer what we could about social distancing in different countries (that is, if we could infer anything at all given some of the grainy data) With over 10 terabytes of images and video, it was possible we might see something.

In the beginning, it wasn't that obvious that simply running basic object detection to detect pedestrians on our camera footage was the best way forward. We didn't really have any idea what kind of crowd sizes we'd see in the data, given that it was mid-March and social distancing hadn't really fully set in yet. Google searches on "crowd counting", returned recent, sophisticated AI methodologies far beyond basic object detection, that claimed to work better and faster - like density methods, context-aware models, and more scary-sounding things that I hadn't heard of before that point. We came across this list of recent crowd counting methods early in the research phase and systematically narrowed them down based on benchmark results on famous datasets and availability of open-source code. After trying a few of them out on our data, we realized two things: 1) most of these fancy methods worked well only on images of super dense crowds, and 2) none of our images ended up having such large crowds! Judging from those preliminary results, it was good to see that social distancing had in fact begun to set in in a few key tourist areas like Times Square, and also that it might be possible to detect and report social distancing solely from our camera footage.
After realizing that recent crowd counting methods wouldn't really work well for us, we went back to basic object detection and started digging around. Pedestron, a repository featuring detection models heavily trained on pedestrian datasets, came to our rescue. Some of these models performed REALLY well on our data, which we weren't expecting from standard object. It was quite amazing to observe some of the results on a few test images with tiny people showing up in various corners of the image.

Given the amount of traffic cameras we had, it made sense to detect numbers of cars as well. If people are going out less, there should be fewer vehicles on the road. We made the same mistake of trying to apply recent "traffic estimation" methods to our data. Turns out, good old YOLO trained on MS COCO works incredibly well, even on very, very grainy vehicles in our data. We used the "car", "truck", "motorcycle", and "bus" categories to define vehicles.

After a couple of months of painstakingly collecting and analyzing the data, we actually found some cool trends. In some European countries, we could see the numbers of people and car increase over time, as in these scatterplots. The different colors represent different chunks of time designated by key events in that country, like a country-wide lockdown or reopening. In France and Austria, there's a pretty clear correlation between vehicle and pedestrian activity over time.

On the side, we developed our own algorithm for detecting actual social distancing between people in an image. So far, we were only counting people. Those numbers hint at social distancing when viewed over time, but don't really provide much insight into social distancing.
By March, a lot of open source developers already used object detection on a steady camera feed and measured a static distance between people's bounding boxes to classify two people as "in violation" or not. Some even took it a step further and transformed the feed so it was all on a 2D level plane, making any calculations between bounding boxes even easier and more uniform. Unfortunately, none of these methods would have worked for us as is. First of all, our data comes from 30,000 cameras which zoom, pan, and tilt all the time. So there's no way we could define a static arbitrary number used to designate a distance as being "in violation". Second, all the image transformation methods seemed to be manual. We couldn't do that for 30,000 cameras! Also, deep learning methods do exist to detect depth in images in terms of actual feet, but that wouldn't be very efficient to apply given the scale of the data either. Also, how exactly would we deal with different camera angles there?
So, we needed a method that was robust to camera angles and used some sort of relative distance metric to determine a social distancing violation.
I dreamed up this method one day while scribbling furiously on my whiteboard, realizing that relative bounding box sizes are all we really need.
Detect bounding boxes as normal. Then, make the following assumptions;
- All people are the same height
- All boxes detected in the image are in fact people
- People are standing upright
Yes, these assumptions are asking for a lot and are not always valid. But given the scale of our data, it was very difficult to check how often these assumptions were actually true. In most cases, when we observed the footage with our own eyes, people were far enough away from the camera that differences in height didn't matter, and they were standing upright. In a few cases, yes, people sat down on the beach or there were kids included in the footage. But for estimating numbers of violations in thousands of cameras, we thought this was a pretty scalable approach compared to what was already out there.
Anyways, on to the actual calculation (better explained in the paper, which I'm quoting below):
We calculate a metric “depth similarity”, P, by dividing the area of the smaller bounding box by the area of the larger bounding box.
Then, we calculate euclidean distance between the bounding box centers, D, measured in pixels.
We scale this distance by the average bounding box height to obtain “inverse relative distance”, ID.
Finally, we multiply ID by P to obtain a number ranging from (0, image height in pixels) unless D is zero, in which case the centers of each bounding box overlap.
If the product is greater than 1, this indicates the two people are within an average person’s height of one another. However, if this product is greater than (6/5.4) = 1.11, this indicates the two people are within 6 feet of each other. Since the accepted standard of social distancing is normally 6 feet, we use this threshold for our experiments.
So basically, given 2 bounding boxes A and B where A is smaller, we calculate
P = (Area of A)/(Area of B)
D = euclidean distance between A and B
Scaled distance ID = (Area of A + Area of B)/2 *(1/D)
consider P*ID. If >1.11, label as violation.
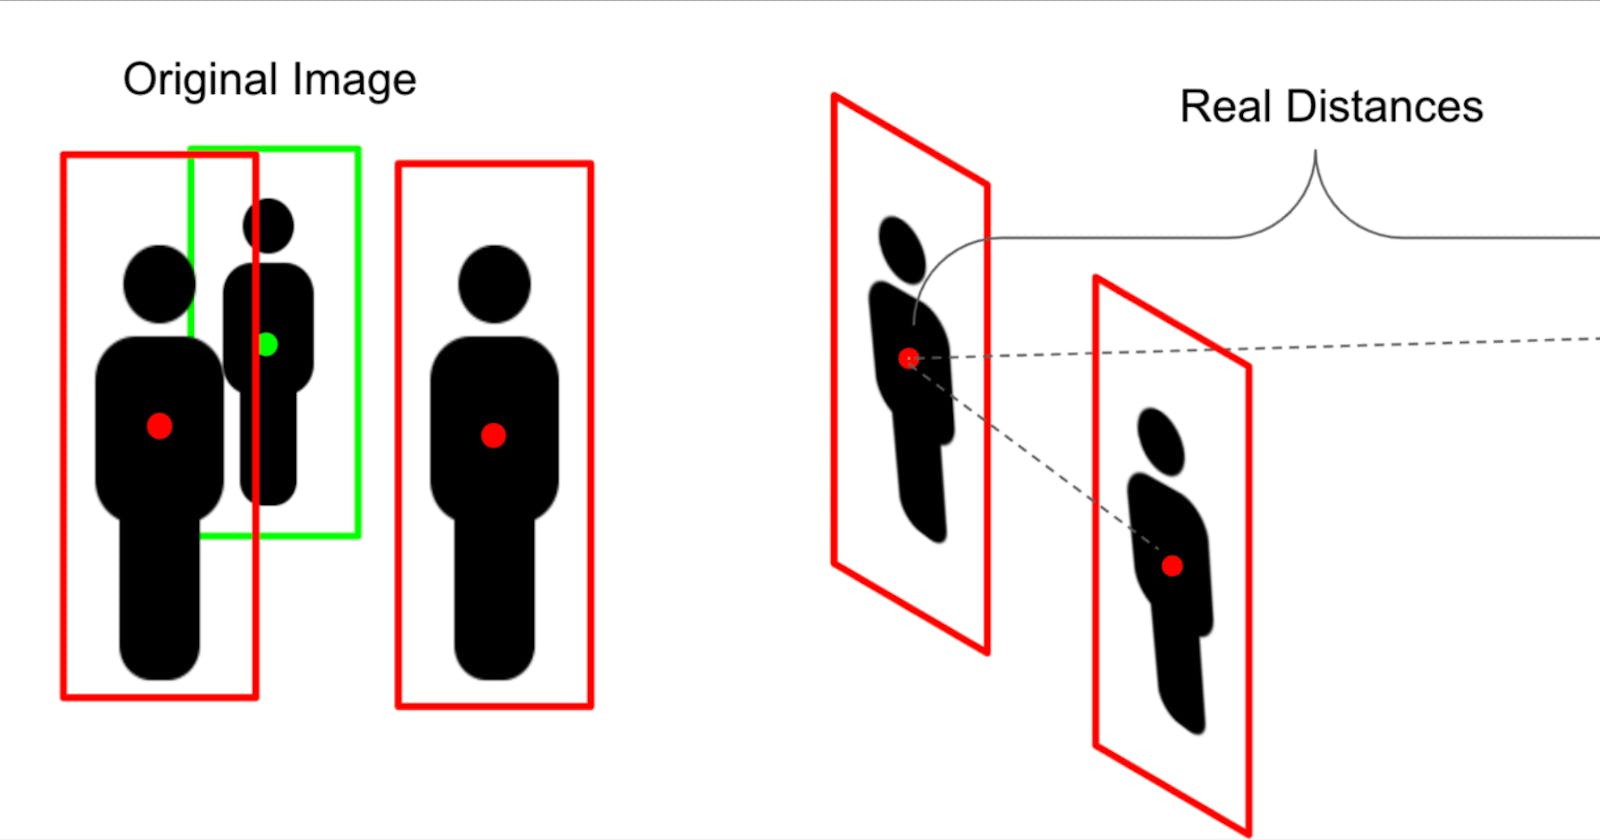
Here's an intuitive graphic of what this method is supposed to accomplish (red are in violation):

and how it does on a case where not all the assumptions are met:

It's not perfect and there's definitely room for improvement. But it was fun to think up this method.
Full results and documentation can be found in the paper! Go check it out!
This project was also covered in New Scientist and a couple of Purdue blog posts:
All the code for the project is open source and can be found here.
I was lucky to be safe during this pandemic. So many others, especially the front lines of health care workers, have been exposed to COVID-19. Our research team hopes that our findings will benefit pandemic research in some small way.